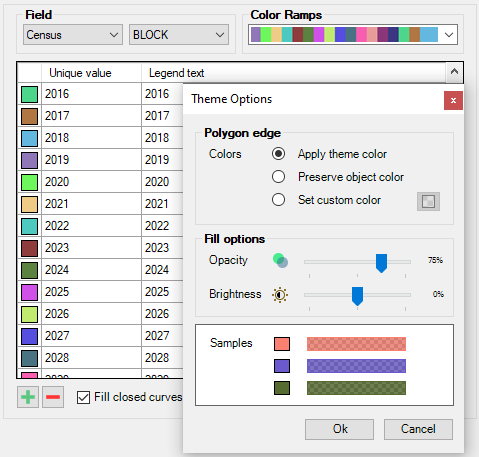
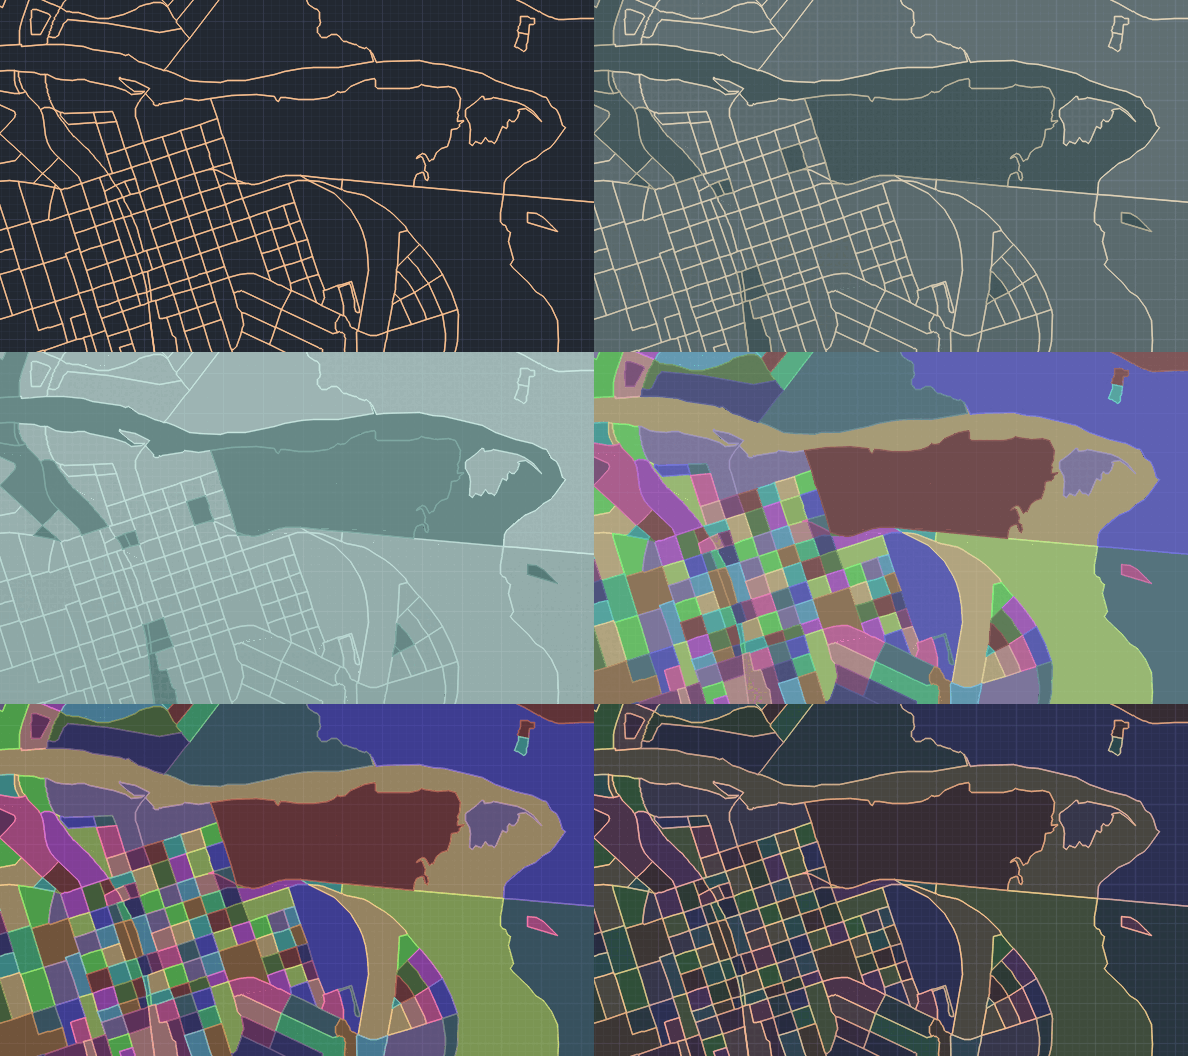
Visualize objects by coloring them based on their field values. Different thematic styles can be applied, using either fixed field values (categorized) or value ranges (graduated). Choose from predefined color schemes, modify them, or create custom styles. Automatically fill closed objects for improved visualization.
Available for AutoCAD, BricsCAD, ZWCAD and GstarCAD
Thematic type
- Categorized: Distributes object Styles by Qualitative values. Examples include building uses, soil classifications, municipalities by region, or planning zones. All field types are allowed for a maximum of 500 different values
- Graduated: Distributes object Styles considering value Ranges. Examples include rivers by flow, buildings by height, or urban areas by population density. Numeric fields (including date/time) are allowed
- Graduated Gradient: Distributes object Styles considering value/color Ranges, creating one or more Gradients. Examples include altimetry representations, or heat maps. Numeric fields (including date/time) are allowed
Easily compare between different dynamic visualizations
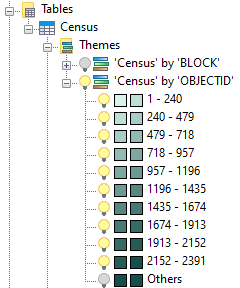
Save thematics in the drawing and change the visibylity of them, even each category of range directly on the Spatial Manager palette
Related commands
- SPMDATATABLEDEFINE: Defines, restores, modifies, renames or deletes a data table or its fields
- SPMDATATABLEATTACH: Attaches one or more objects to a data table
- SPMDATATABLEDETACH: Detaches one or more objects from attached data table
- SPMDATATABLEGRID: Opens and displays the ‘Data Grid’ palette
Note: Some functionalities can be found in the Standard or Professional editions only


